


01
Published plan
The schedule available through OAG.
See ahead. Decide with evidence.
Predictive decision intelligence for Airfreight.
PREDICTIVE DECISION INTELLIGENCE FOR AIRFREIGHT
Forecast rates. Test disruption scenarios. Trace network exposure.
For commercial, operational and financial Airfreight teams.
01 · Market forecast
See a market-rate corridor for the next 4, 8 and 12 weeks — with uncertainty left visible.
See the evidenceNear-term view
The narrowest corridor for the next four weeks.
02 · Scenario intelligence
Hub closure, strike or tariff change: compare the baseline with a conditional market and network view.
From event to scenario outlook
News → Structured event → Entity mapping → Network exposure → Scenario outlook
Baseline
Scenario outlook
Release status
Review required before release · No outlook when the evidence is insufficient.
Conditional scenario · not a claim of cause and effect
News and event feeds create a structured input.
The event is classified by type, place, time and mode.
Airports, hubs, regions, airlines and commodities are connected.
Direct and downstream network paths become visible.
Baseline and scenario corridors remain visibly separate.
The system releases the view — or abstains.
03 · Network intelligence
Trace direct exposure, downstream connections and relevant Air–Sea alternatives across the Airfreight network.
Hub · Lane · Airline · Region · Commodity
A connected view of the Airfreight network and its relevant multimodal corridors.
Shown only where an Air–Sea corridor and a relevant commodity profile are mapped.
04 · Decision intelligence layer
Rates, schedules, flown movements, events, commodities and approved customer data — aligned by time, identity and context.
01 · Data sources
Rates, schedules, movements, events and cargo data retain their source meaning.
02 · Identity
Airports, airlines, lanes, events and commodities are resolved consistently.
03 · Time
Event, publication and availability time remain distinct.
04 · Network
Hubs, lanes, regions, airlines, commodities and events become one market graph.
05 · Forecast
Forecast, scenario and network views are generated.
06 · Evidence
Only outputs that pass the checks are released.
07 · Customer context
Approved customer data applies the intelligence to a specific network without mixing tenants.
Decision views
Market outlook
Scenario outlook
Network outlook
Schedule reality
Available viewCompare the published schedule with flown movements and see where the network deviates from plan.
01
The schedule available through OAG.
02
Aircraft type and payload frame potential physical capacity.
03
ADS-B or TAC Space shows what actually flew.
04
The visible difference between the published plan and flown reality.
Illustrative view · no measured effect. Aircraft context frames potential capacity. Flown movements do not measure transported cargo or load factor.
05 · Lane DNA
Commodity mix reveals which events, connections and Air–Sea corridors matter for the lane.
01 · Movement
Planned and flown movements define the physical route.
02 · Aircraft
Aircraft type and payload frame potential capacity.
03 · Cargo
WACD and approved AWBs reveal the commodity structure.
04 · Lane DNA
Its cargo profile informs forecast, scenario and network views.
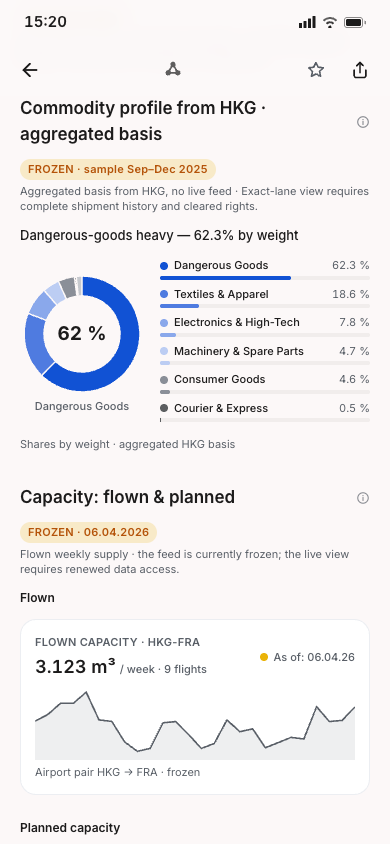
Illustrative product preview · example data, not measured
Scroll to explore
06 · Evidence
Frozen at the forecast date. Tested on unseen weeks. Compared with transparent baselines.
Use only information available at the forecast date
Test on weeks the model has not seen
Measure against a transparent reference
Challenge the result with negative controls
Show only what passes
Release discipline
Only released intelligence reaches the product.
Decision support — never an automatic pricing, procurement or trading instruction.
07 · Decision views
Apply the same market and network view to the questions each Airfreight team owns.
Forwarders
No automated buying or pricing recommendation.
Airlines · GSA/GSSA
Yield requires airline-owned revenue, chargeable-weight, segment, mix and capacity data.
Airports · Ground handling
Workload and resource outlooks require airport or handling data.
Banking · Research · Strategy
No automated trading instruction or investment recommendation.
Customer data remains isolated while each team receives a view of its own network and decisions.
Start with one question
Choose a lane, airport or disruption scenario. We will show the outlook, the network context and the evidence behind it.
Direct contact
Partners can access the product preview and its evidence trail.
Partner access


